Money Vikings Investing - Prep for Week of 9/24
In This Issue: Market Report, Finviz/Sector Analysis, 5 Elements of Financial Freedom, Weekly Sentiment Analysis, Hot🔥Trade Ideas
Fear of more rate increases, higher inflation, and government shutdowns spooked the market this week. Every sector was down, and only the VIX, the 10 year, and Dollar were up. Consumer Discretionary was down almost 6%! Over half of the stocks are declining, 89% are at new lows, and only 20% are trading above their 200 SMA. At least Bitcoin is somewhere near the 27K mark. I don’t know about you, but I’m ready to see Dumb Money!
Finviz Heat Map 9/18-9/22 Weekly
The Finviz Heatmap visually represents stock performance through color and size indicators. Red signifies declining stock prices, while the size of the stocks reflects their market capitalization. Additionally, the heatmap is divided into sectors, allowing users to quickly assess performance within specific industries. Clearly Consumer Discretionary and Real Estate were the worst hit. I guess that’s why Greg is adding more O 0.00%↑ (Realty Income) these ridiculous lows, getting close to 6% in dividends for the long term.
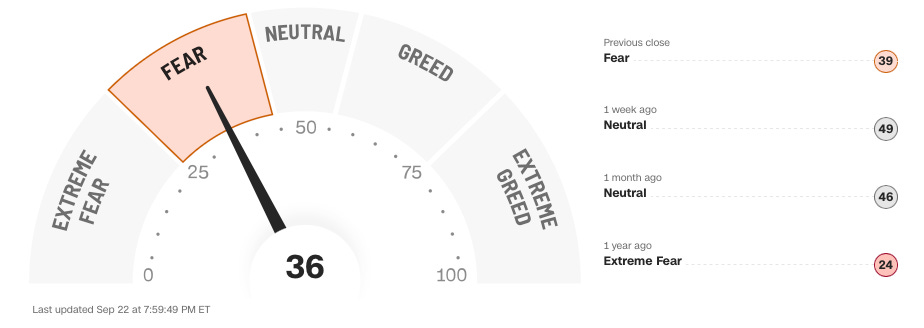
Fear and Greed Index
The Fear and Greed Indicator is a tool used to gauge the overall market sentiment based on several indicators. It provides valuable insights into investor behavior by analyzing factors such as volatility and options trading. When volatility is increasing and more people are buying puts than calls, it indicates a higher level of fear in the market. Conversely, if the indicator shows more people buying calls than puts, it suggests a higher level of greed. We are at .95 this week and rising, so that represents an increase in fear. This indicator serves as an important tool for investors to assess market conditions and make informed decisions. This week we declined from 49 to 36, a large move in Fear.
VIX
An increase from 13 to 17. The VIX, or the CBOE Volatility Index, is significant for several reasons. Primarily, it serves as an indicator of the expected 30-day volatility of the S&P 500, providing insights into the market’s sentiment and risk perception. When the VIX rises, as seen in recent times, it signals heightened fear and uncertainty among investors. Conversely, a declining VIX generally suggests a more bullish sentiment. Understanding the VIX is particularly important for options trading, as high volatility is preferable for selling options, while low volatility is preferable for buying options.
SPY
The performance of the S&P 500 over the last year has shown some notable bullish trends. Currently, it is trading below both the 10-day (blue) and 50-day (green) moving averages, indicating a potential downward trend. However, it is important to note that the S&P 500 remains above the 200-day moving average (red), suggesting some level of longer term stability.
Interest Rates
Interest rates are all rising. Jerome Powell didn't hike this past week, but left future hikes on the table. Rising yields make the price of bonds go down. The yield curve is inverted indicating low confidence in the future, and a possible predictor of a recession.
Earnings
Not a huge set of earnings next week, however we have COST 0.00%↑ , NKE 0.00%↑ , and MU 0.00%↑ coming up. Perhaps they might make some decent Iron Condors or Strangles with the recent increased in Implied Volatility Rank.
Economic Events
Will be watching consumer confidence on Tuesday, and Core PCE on Friday. Powell also will have a few words on Thursday which is always fun for those who enjoy volatility.
How to Achieve Financial Freedom? - Not what you think!
Checkout Greg’s latest YouTube video on the 5 Elements to Financial Freedom. Some will be sure to surprise you!
YouTube | Blog | Book | Podcast | ☕️
HotTrades


